Account Payable Period Formula Explained with Examples
Learn the account payable period formula, how to calculate days payable outstanding, worked examples, and what your result means for cash flow.
The account payable period formula is Average Accounts Payable ÷ Cost of Goods Sold or Credit Purchases × 365, and it tells us the average number of days a business takes to pay suppliers. If you're trying to protect cash without upsetting vendors, this is one of the clearest day-based measures to track.
Most finance teams know the feeling. Supplier invoices are coming due, cash needs to stretch through payroll and overhead, and someone is asking whether the business is paying too fast, too slow, or about right. Small business owners often feel the same pressure, just without a full finance department to sort it out.
That's why this metric matters. It's not just an accounting ratio that sits in a report. It describes a real business rhythm: when we buy, when we owe, and when cash leaves the bank.
Think of it as a timeline question. We receive goods or services today. The supplier gives us time to pay. Then, somewhere down the line, we settle the bill. The account payable period measures the average length of that gap in days.
When we understand that gap, we can make better decisions about working capital. We can spot whether cash is leaving earlier than it needs to. We can also see when long payment cycles might be signaling strain instead of strategy. That difference matters, because holding cash a little longer can help operations, but paying late without agreement can damage supplier trust.
Table of Contents
- Introduction Why Payment Timing Matters
- Understanding What the Accounts Payable Period Measures
- The Account Payable Period Formula and Its Inputs
- Worked Examples That Show the Calculation Step by Step
- How to Interpret Your Result and What Good Looks Like
- Using the Metric to Improve Cash Management
- Key Takeaways and Next Steps for Your Business
Introduction Why Payment Timing Matters
A familiar month-end scene plays out in many businesses. The purchasing team has stocked up, invoices are sitting in accounts payable, and the owner is watching the bank balance closely because payroll, rent, and tax payments are all nearby. Nobody wants to pay suppliers recklessly early, but nobody wants a call from a key vendor asking why their invoice is overdue.
That tension is exactly where the account payable period becomes useful.
The cash-flow story behind the formula
Every supplier invoice creates a short story with three moments:
- We buy something
- We record the payable
- We pay the supplier
The formula turns that story into a day count. Instead of asking vague questions like "Are we slow to pay?" we can ask a sharper one: On average, how many days pass before supplier balances are settled?
That helps both accountants and owners. Bookkeepers can monitor payment patterns more consistently. Finance teams can compare periods and spot changes in working capital behavior. Owners can see whether cash is being preserved intentionally or drifting out too quickly.
A payable balance isn't just a liability on paper. It's time. The formula converts that time into a number we can manage.
Why this isn't just a textbook ratio
This measure sits close to day-to-day decisions. If the period is short, we may be paying sooner than our terms require. If it's long, we may be preserving cash, or we may be slipping behind. The number alone doesn't tell the whole story, but it gives us a strong starting point.
A lot of confusion starts because people memorize the formula without connecting it to operations. We'll keep it practical instead. We'll treat the ratio as a cash-flow timeline, walk through the inputs in plain English, calculate it step by step, and then look at what high and low results usually mean in real working situations.
Understanding What the Accounts Payable Period Measures
The account payable period measures the average number of days we take to pay suppliers. This metric asks: once a supplier invoice enters the system, how long does it usually take before cash leaves our account?
That's easier to understand if we compare it to a household bill cycle. We receive the utility bill now, but we don't usually pay it the same minute it arrives. There's a window between receiving the bill and paying it. A business has that same kind of window with supplier invoices.
Why we express it in days
Days are intuitive. Most owners don't naturally think in turnover ratios, but they do understand timing. Saying "we pay suppliers in about this many days" gives a direct picture of cash behavior.
It also helps us line this measure up with the broader working capital cycle. Businesses buy inventory or services, sell to customers, collect cash, and pay suppliers somewhere along the way. If you want a useful refresher on how payables and receivables interact, this overview of AR and AP working capital relationships gives helpful context.
Core concept: The account payable period is a timing measure, not a judgment. It tells us how long payment takes on average. It doesn't automatically tell us whether that timing is healthy.
Where readers often get mixed up
The main confusion is between accounts payable turnover and days payable. They describe the same underlying behavior from different angles.
- Turnover asks frequency: How many times do we clear payables during a period?
- Payable period asks duration: How many days do we take to pay?
- Operations teams prefer days: It matches invoice terms and payment schedules more naturally.
Another common mix-up is assuming the metric captures whether every invoice was paid on time. It doesn't. A company can show a long average period because it negotiated longer terms, or because it fell behind. We need context to tell the difference.
Who uses this metric
Different people read the same number for different reasons:
- Accountants use it to evaluate consistency and support close-review discussions.
- Bookkeepers use it to monitor whether payment timing is changing from one period to the next.
- Finance teams use it alongside receivables and inventory measures to manage working capital.
- Owners use it to answer a practical question: are we preserving cash wisely, or creating supplier tension?
That's why this ratio stays useful across businesses of different sizes. It translates accounting records into a time-based operating signal.
The Account Payable Period Formula and Its Inputs
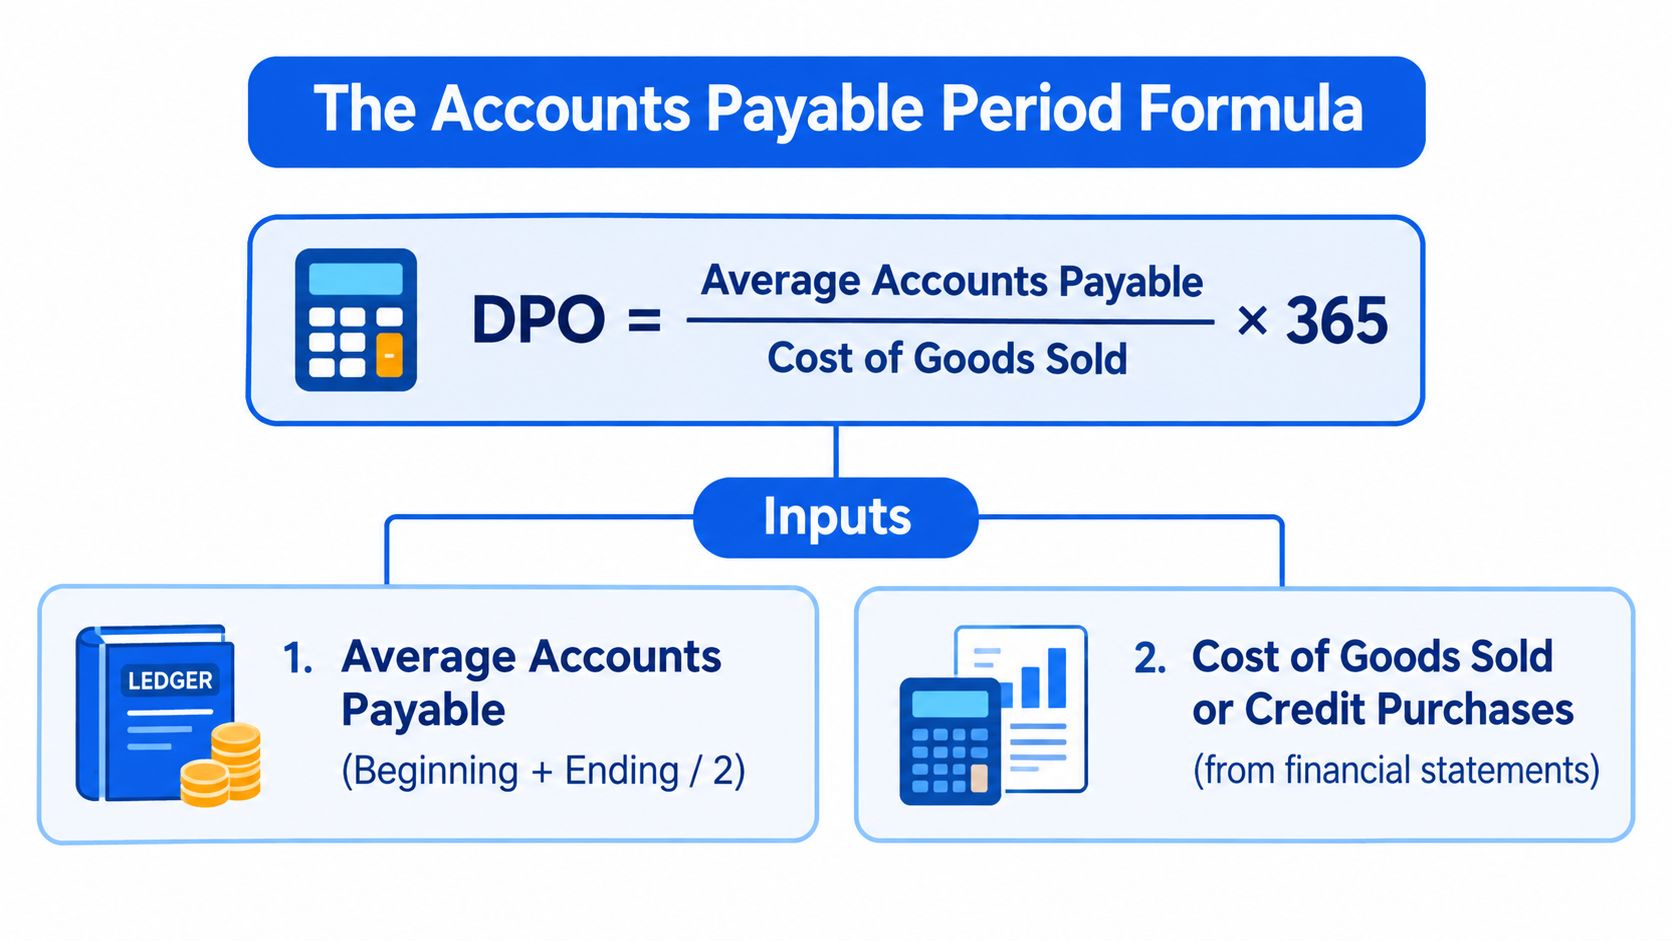
The standard account payable period formula is:
Average Accounts Payable ÷ Cost of Goods Sold or Credit Purchases × 365
Some teams use a different day count for internal reporting, but the important thing is consistency. If we compare one period using one day basis and another period using a different basis, the trend becomes harder to trust.
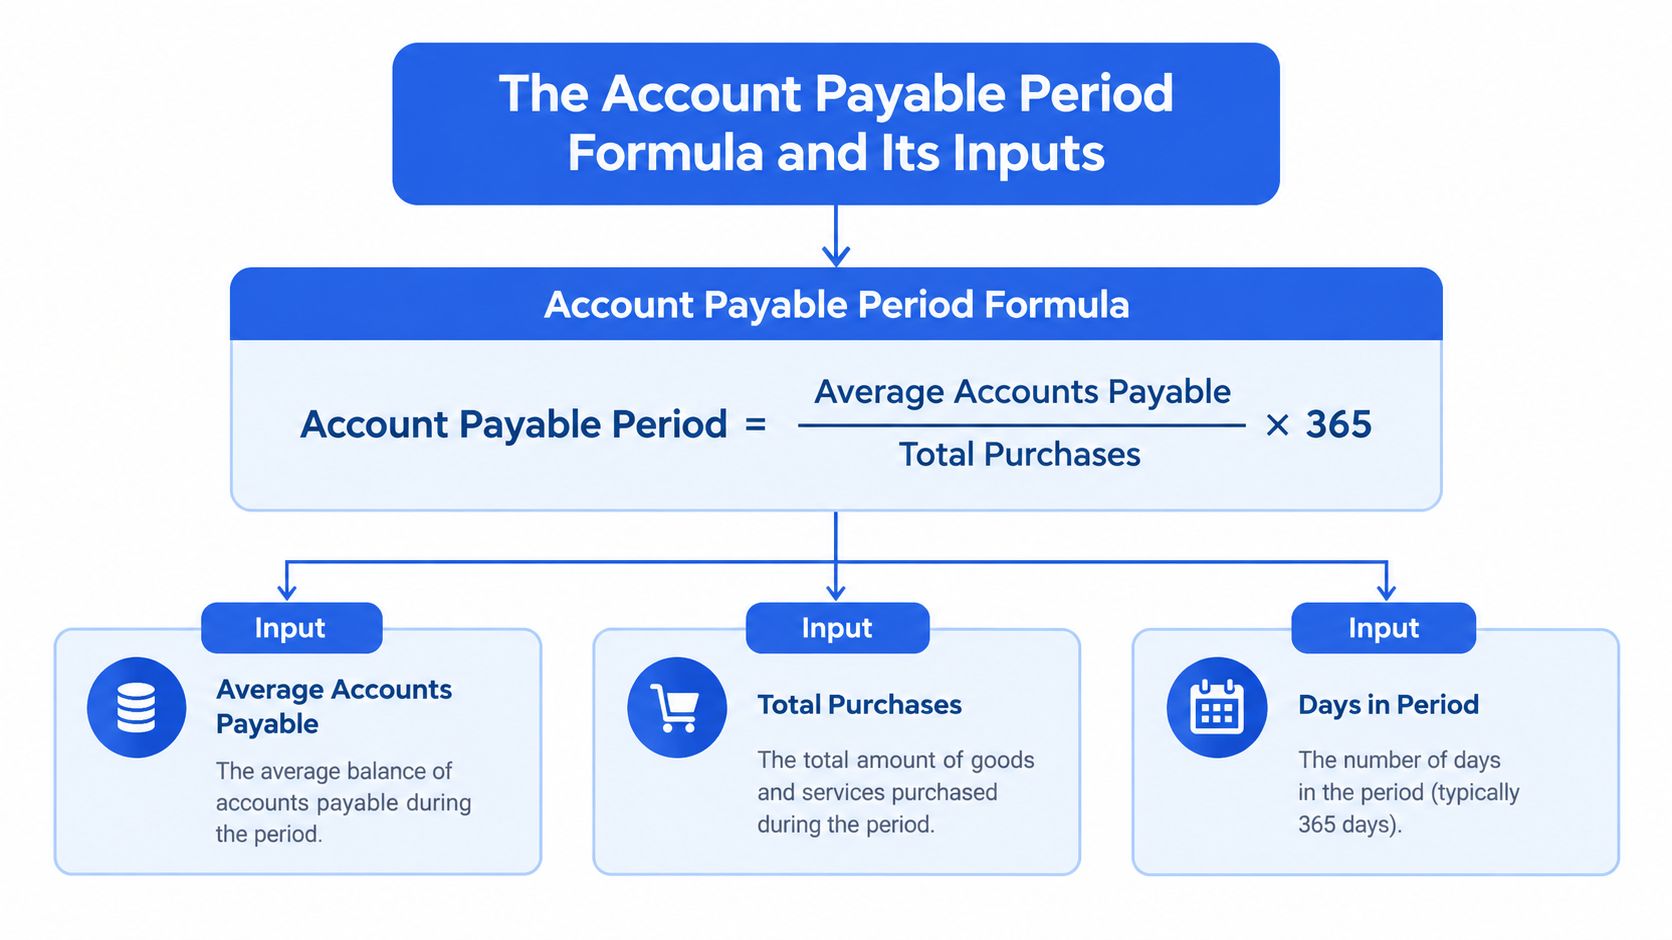
Input one average accounts payable
This is the balance we owe suppliers, averaged over the period. In plain terms, we don't want to use just one end-point balance if that balance happened to be unusually high or low.
The usual approach is:
Beginning Accounts Payable + Ending Accounts Payable ÷ 2
That gives us a midpoint. It smooths out the snapshot effect that can happen when a large invoice lands right before period-end or a payment run clears just before reporting day.
Input two cost of goods sold or credit purchases
Many readers hesitate when faced with this choice.
- Use credit purchases when the business tracks supplier purchases cleanly and can separate them from cash purchases.
- Use cost of goods sold when credit purchase detail isn't readily available and COGS is a reasonable operating proxy for the purchased inputs tied to supplier activity.
For some businesses, especially product-based ones, COGS can be practical. For others, especially where expenses don't map neatly into inventory flow, credit purchases may give the cleaner picture.
Where to find the numbers
Teams gather the inputs from routine accounting records:
- Average accounts payable usually comes from the balance sheet or trial balance.
- COGS comes from the income statement.
- Credit purchases may come from purchasing reports, the general ledger, or AP subledger detail.
If your source data is messy, the formula itself isn't the problem. The input quality is.
A useful operational companion is good reconciliation discipline. This walkthrough on how to reconcile bank statements is a strong reminder that reliable ratios depend on reliable underlying records.
Practical rule: If you mix cash purchases with credit purchases, or use a year-end payable balance instead of an average, the result may look precise while telling the wrong story.
Two pitfalls to avoid
First, don't grab the closing accounts payable balance and call it average. That shortcut can distort the period badly if activity fluctuates.
Second, don't treat all purchases the same if some were paid immediately. The ratio is about the time we take to settle supplier obligations that sit in payables. If a purchase never entered accounts payable, including it can weaken the logic of the calculation.
Worked Examples That Show the Calculation Step by Step
Examples make this ratio click. Below are two versions of the same idea. The first uses straightforward annual figures. The second starts with a quarter and annualizes the purchase base so we can compare methods.
Worked calculation comparison
| Input | Example A Annual | Example B Quarterly Annualized |
|---|---|---|
| Beginning accounts payable | 40,000 | 18,000 |
| Ending accounts payable | 60,000 | 22,000 |
| Average accounts payable | 50,000 | 20,000 |
| Purchase base used | Credit purchases of 300,000 | Quarterly credit purchases of 90,000, annualized to 360,000 |
| Day count | 365 | 365 and 360 |
Example A annual supplier cycle
Let's say a small wholesale business starts the year with accounts payable of 40,000 and ends with 60,000. Its average accounts payable is:
(40,000 + 60,000) ÷ 2 = 50,000
Assume total credit purchases for the year are 300,000. The formula becomes:
50,000 ÷ 300,000 × 365
Now calculate step by step:
- 50,000 ÷ 300,000 = 0.1667
- 0.1667 × 365 = 60.8 days
So the business pays suppliers in about 61 days on average.
Does that make sense? Yes, if the company generally works on monthly-plus terms or deliberately holds cash for several weeks before payment. If supplier contracts are much shorter, this result would prompt a closer look.
Example B quarterly data annualized
Now suppose we're reviewing one quarter for a manufacturer and want to estimate an annual-style payable period for comparison.
Beginning accounts payable is 18,000 and ending accounts payable is 22,000:
(18,000 + 22,000) ÷ 2 = 20,000
Quarterly credit purchases are 90,000. To align with a yearly day basis, we annualize purchases:
90,000 × 4 = 360,000
Using a 365-day basis:
- 20,000 ÷ 360,000 = 0.0556
- 0.0556 × 365 = 20.3 days
Using a 360-day basis:
- 20,000 ÷ 360,000 = 0.0556
- 0.0556 × 360 = 20.0 days
The difference is small, but it shows why consistency matters. The result changes slightly depending on the day count convention.
A smart verification check before trusting the inputs
Before we rely on purchase and payment data, we should check whether the bank statement records themselves hold together. A practical accuracy check is to verify that opening balance plus credits minus debits equals closing balance, as explained in this guide to reading bank statement summaries and balances. If that simple equation doesn't work, the statement data may be incomplete or misread.
For formal reconciliation discipline, the process starts by matching the opening balance on the bank account with the opening balance on the bank statement, then adjusting for items not yet recorded on either side, which ties the previous period to the current one according to the CPA Ireland bank reconciliation explanation.
That matters because a payable-period calculation is only as reliable as the transaction history feeding it.
How to Interpret Your Result and What Good Looks Like
A result doesn't mean much on its own. The number becomes useful when we ask what it says about cash, supplier relationships, and payment discipline.
A higher payable period means we hold on to cash longer before paying suppliers. That can support liquidity. It can also mean we're moving too close to due dates, or beyond them, if we haven't aligned with supplier terms.
A lower payable period means we pay faster. That may reflect strong cash availability or a deliberate choice to pay promptly. It can also mean we're letting cash leave the business sooner than necessary.
A simple decision matrix
| Result pattern | What it may signal | What to check next |
|---|---|---|
| High payable period | Cash is being preserved longer, or invoices may be aging too far | Compare to supplier terms and overdue invoice reports |
| Mid-range stable period | Payment timing is broadly consistent | Review trends and any changes in purchasing mix |
| Low payable period | Fast payment habits or early settlement | Check whether cash is being released earlier than terms require |
The point isn't to chase the highest possible result. The point is to match payment timing to business strategy and supplier agreements.
Longer isn't automatically better. If the extra days come from strained cash or late invoices, the metric is warning us, not congratulating us.
Reading high and low results like a finance team
A strong interpretation usually includes three lenses.
Supplier terms lens
If your average result is close to the terms you negotiated, the system may be functioning normally. If it's far longer, that can mean strain or bottlenecks. If it's far shorter, you may be paying well before due dates.
Trend lens
One month or one year can mislead. A single result might reflect timing around period-end, a seasonal stock build, or one large supplier invoice. A trend is more informative than a snapshot.
Business model lens
A retailer, contractor, distributor, and service firm can all show very different payment timing patterns. That's why broad comparison without context can lead to bad conclusions. The same number can look efficient in one business and risky in another.
What good looks like in practice
In practical terms, "good" usually means this:
- Payments align with agreed terms
- Cash is retained sensibly, not recklessly
- Suppliers stay confident in the relationship
- The result stays explainable over time
That last point matters more than many teams realize. If we can explain why the number moved, we usually understand the underlying cash story. If we can't, we need to dig deeper.
Using the Metric to Improve Cash Management
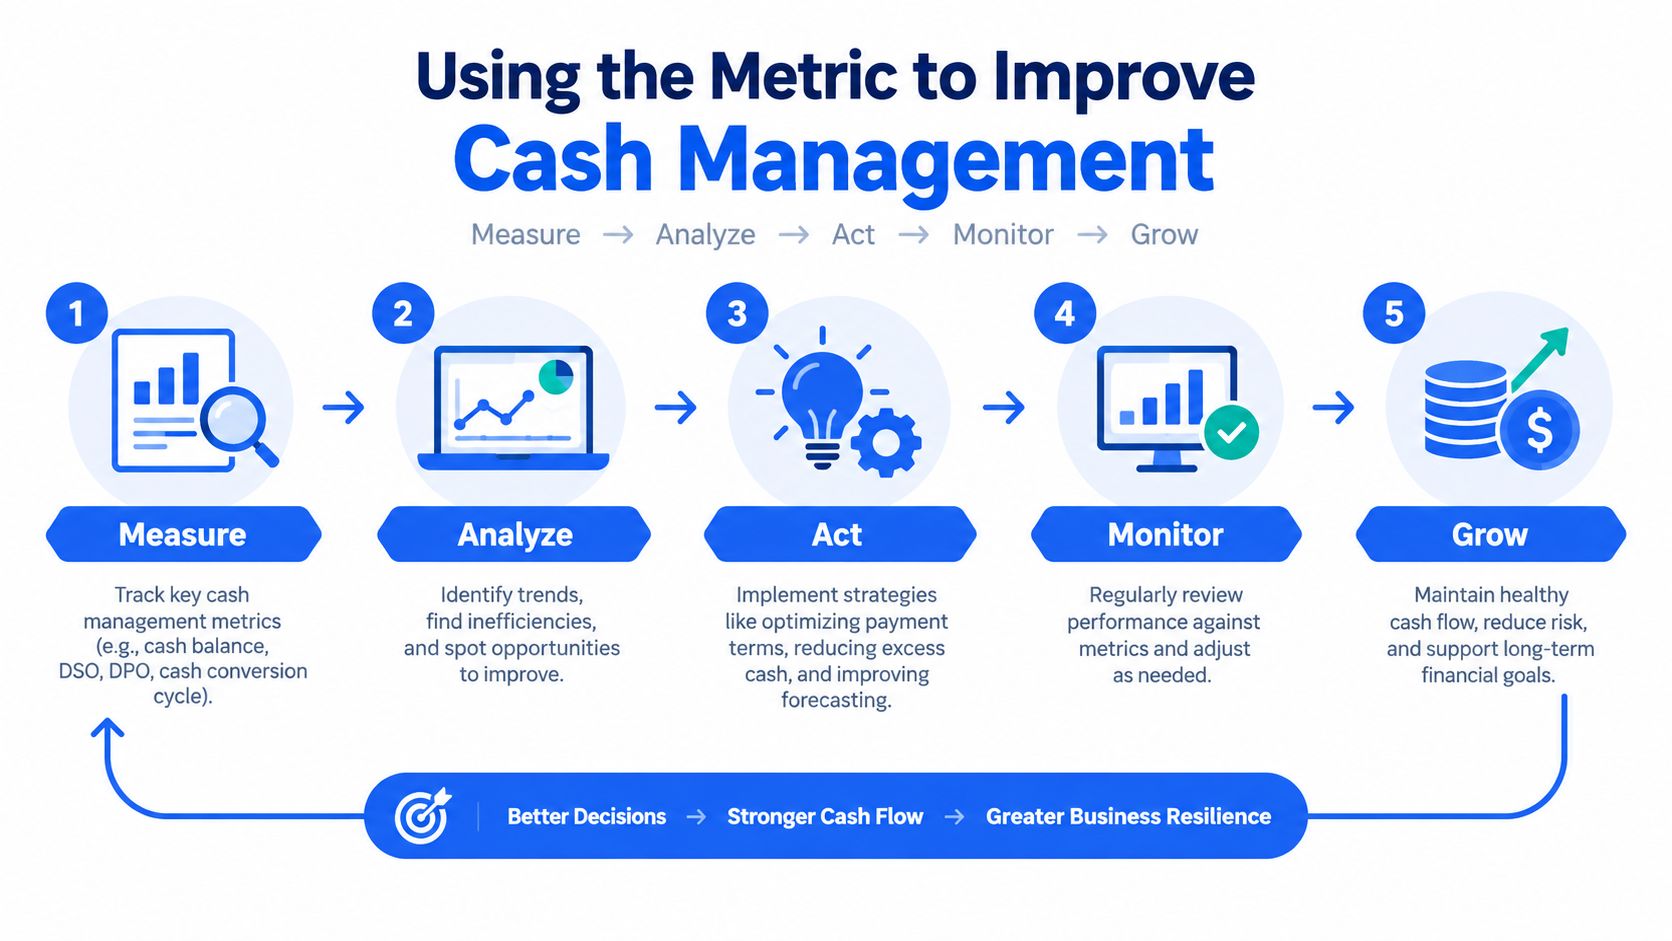
Once the calculation is reliable, value comes from decisions. The account payable period formula helps turn payable timing into an active part of cash management instead of a passive reporting metric.
Use it to forecast cash outflows
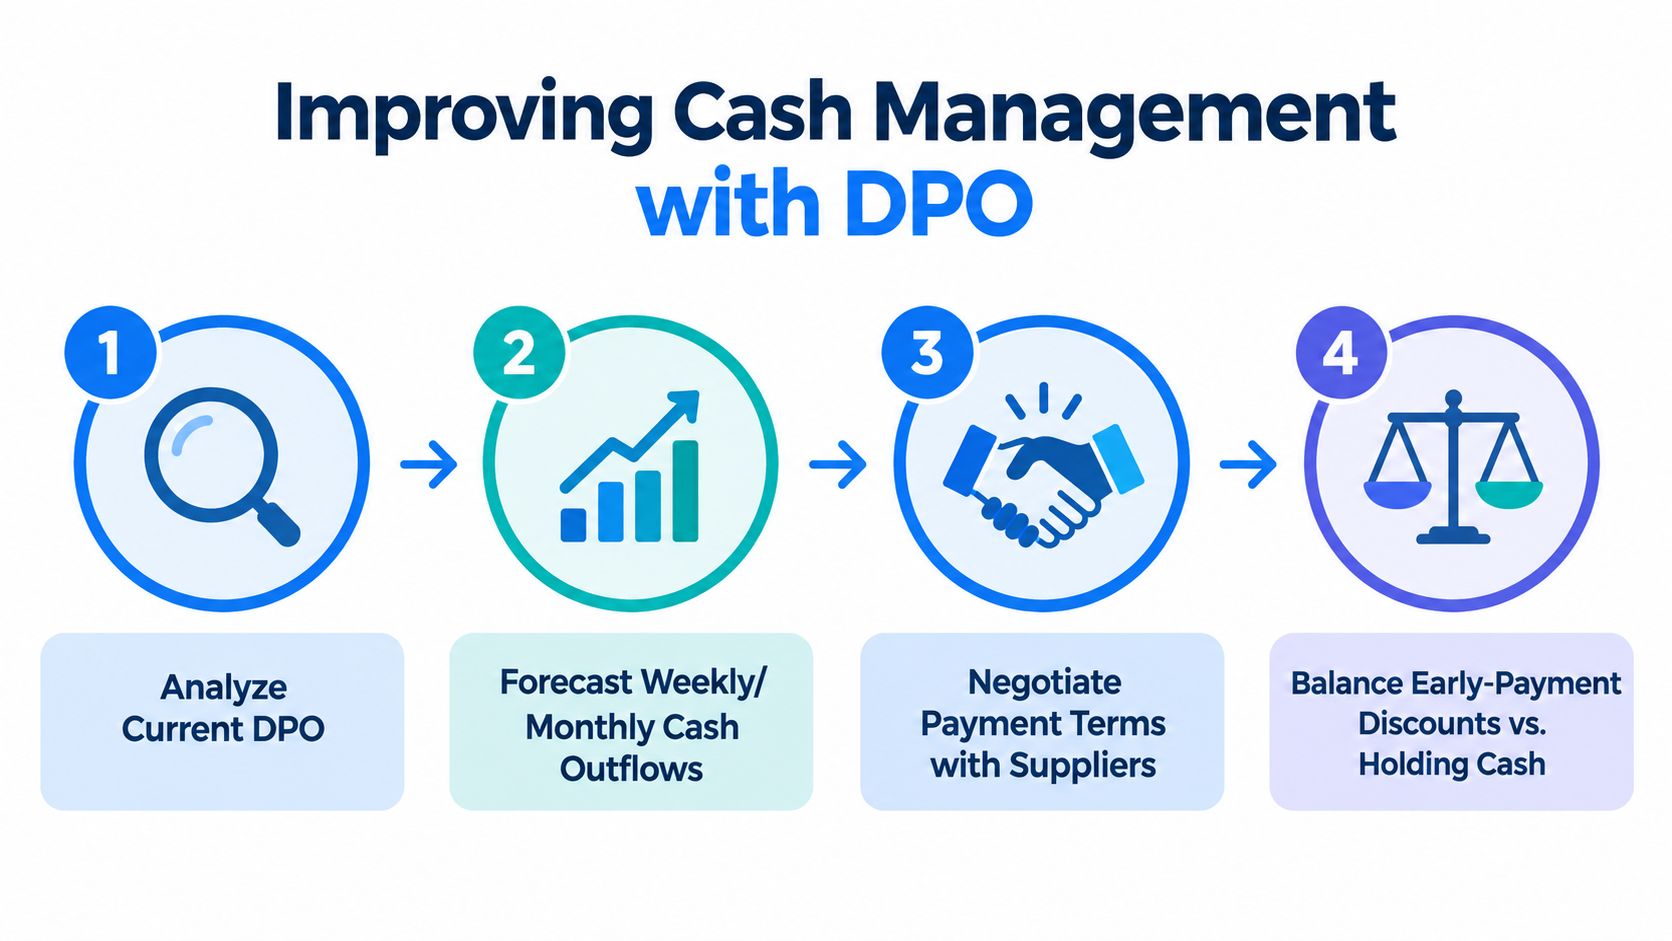
If we know roughly how long payables remain outstanding, we can build better short-term cash expectations. That helps when planning payment runs, vendor funding needs, and weekly liquidity reviews.
A payable period isn't a substitute for a cash forecast, but it sharpens the forecast. It helps us ask whether current invoice volume is likely to turn into near-term bank outflows or later ones.
Use it to challenge payment habits
Many businesses don't have a policy problem. They have a habit problem. Staff may pay invoices immediately after approval even when terms allow more time. Over time, that can pull cash forward unnecessarily.
A disciplined review can uncover questions like these:
- Are invoices being paid on receipt rather than on term?
- Do some vendors get paid earlier because their approvals finish faster?
- Are we consistent across locations, business units, or client books?
Those questions often reveal that the metric is shaped as much by process as by policy.
Use it to balance flexibility and supplier trust
Stretching payables can support working capital. It can also backfire if suppliers tighten terms, delay deliveries, or stop extending credit comfortably.
That's why a healthy approach usually looks like this:
- Review terms supplier by supplier
- Align actual payment timing with those terms
- Escalate exceptions instead of letting them drift
- Track trends alongside receivables and inventory, not in isolation
For teams cleaning up source records first, automated extraction can save a lot of manual work. This overview of automatic data extraction for finance workflows is useful if your payable analysis starts with hard-to-handle PDF statements.
When payable timing improves cash flow without surprising suppliers, that's management. When it improves cash only because invoices age past agreement, that's a warning sign.
Why bank statement quality still matters
Even though accounts payable sits in the ledger, bank data plays a supporting role. Payment timing has to show up in actual cash movement, and errors in statement handling can muddy that picture.
When statements arrive as PDFs, scanned copies, or locked files, teams often waste time copying transactions manually. That doesn't just slow reporting. It raises the chance of using incomplete or inconsistent payment data in cash reviews.
Reliable payable analysis depends on dependable records. Clean statement data, clean ledger data, and consistent reconciliation habits all reinforce each other.
Key Takeaways and Next Steps for Your Business
The account payable period formula is simple, but it becomes powerful when we treat it as a cash-flow timeline rather than just a ratio. We calculate it as Average Accounts Payable ÷ Cost of Goods Sold or Credit Purchases × 365, and the result tells us how many days, on average, we take to pay suppliers.
That number helps us answer practical questions. Are we paying too quickly and releasing cash early? Are we preserving working capital within agreed terms? Or are we drifting into late-payment territory that could strain supplier relationships?
A practical checklist
Use this short checklist when applying the metric:
- Start with average payables: Use beginning and ending accounts payable, then average them.
- Choose the right purchase base: Use credit purchases where available. Use COGS only when it's a sensible proxy.
- Keep day counts consistent: Don't compare results built on different conventions without noting it.
- Verify underlying cash records: Check that opening balance plus credits minus debits equals closing balance before trusting statement-based payment data.
- Support with reconciliation: Tie the current period properly to the previous one so balances are anchored.
- Read the result in context: Compare against terms, trends, and business model realities.
What to do next
The next improvement isn't learning a more advanced formula. It's improving the quality and consistency of the inputs.
If your records are already clean, start tracking the metric regularly and watch the trend. If your purchase and payment data is messy, fix the workflow feeding the calculation first. That usually means better statement handling, tighter reconciliations, and fewer manual copy-paste steps between PDFs and spreadsheets.
The clearer the data, the more confidently we can use the ratio to make cash decisions.
If you're building this metric from bank records and supplier payments, autobankstatement can help by converting PDF bank statements, including digital files, scans through OCR, and password-protected statements, into CSV or Excel/XLSX. It supports bulk upload, accepts files up to 25 MB, offers a free guest preview before payment, gives registered users 24-hour download access, and auto-deletes uploads within 24 hours, which makes it practical when you need cleaner statement data for reconciliation and payable analysis.
Convert your next statement in minutes
Upload a bank statement PDF — digital, scanned, or password-protected — preview the extracted table, and download clean CSV or Excel.