
Financial Statement of Bank: What It Is and How to Read It
Learn what a financial statement of bank contains, how it differs from a customer bank statement, and how to read its key components.
Two PDFs arrive in the same inbox on the same morning, and both carry the same bank's logo in the top corner. One runs to nearly two hundred pages, opens with a chair's letter and closes with auditor signatures. The other is three pages, begins with a balance brought forward and ends with a closing balance in bold. Both get saved as "bank statement". A week later someone asks how much capital that bank holds, and reaches for the wrong file.
That mix-up sits at the centre of almost every conversation about a financial statement of bank reporting. The phrase covers two documents with nothing in common beyond the letterhead. One is the institution's published financial statement, prepared for shareholders, regulators and bond investors. The other is your account statement, prepared for you.
We'll take them one at a time, in plain language. Where the numbers come from, which headline figures mislead, and how to prove the arithmetic before anything gets posted to a ledger.
Table of Contents
- Bank Financial Statements and Customer Bank Statements Compared
- The Four Statements a Bank Publishes and What Each Shows
- Reading the Balance Sheet and Income Statement Together
- Capital and Liquidity Ratios Banks Report Beyond Profit
- How to Test Whether a Customer Statement Adds Up
- Choose the Right Statement Before You Analyze or Reconcile
Bank Financial Statements and Customer Bank Statements Compared
Start with what each document is for. A bank's published financial statement describes the whole institution. It presents a balance sheet, an income statement, a cash flow statement, a statement of changes in equity and a set of notes that explain all four. A customer bank statement describes one account, held by one person or company, across one statement cycle, showing each transaction and the balance after it.
A retail analogy makes the boundary obvious. The store's annual accounts summarise the whole business, every location, every cost line. A single till receipt tape records one register's sales for one day. Both are accurate. Neither can stand in for the other.
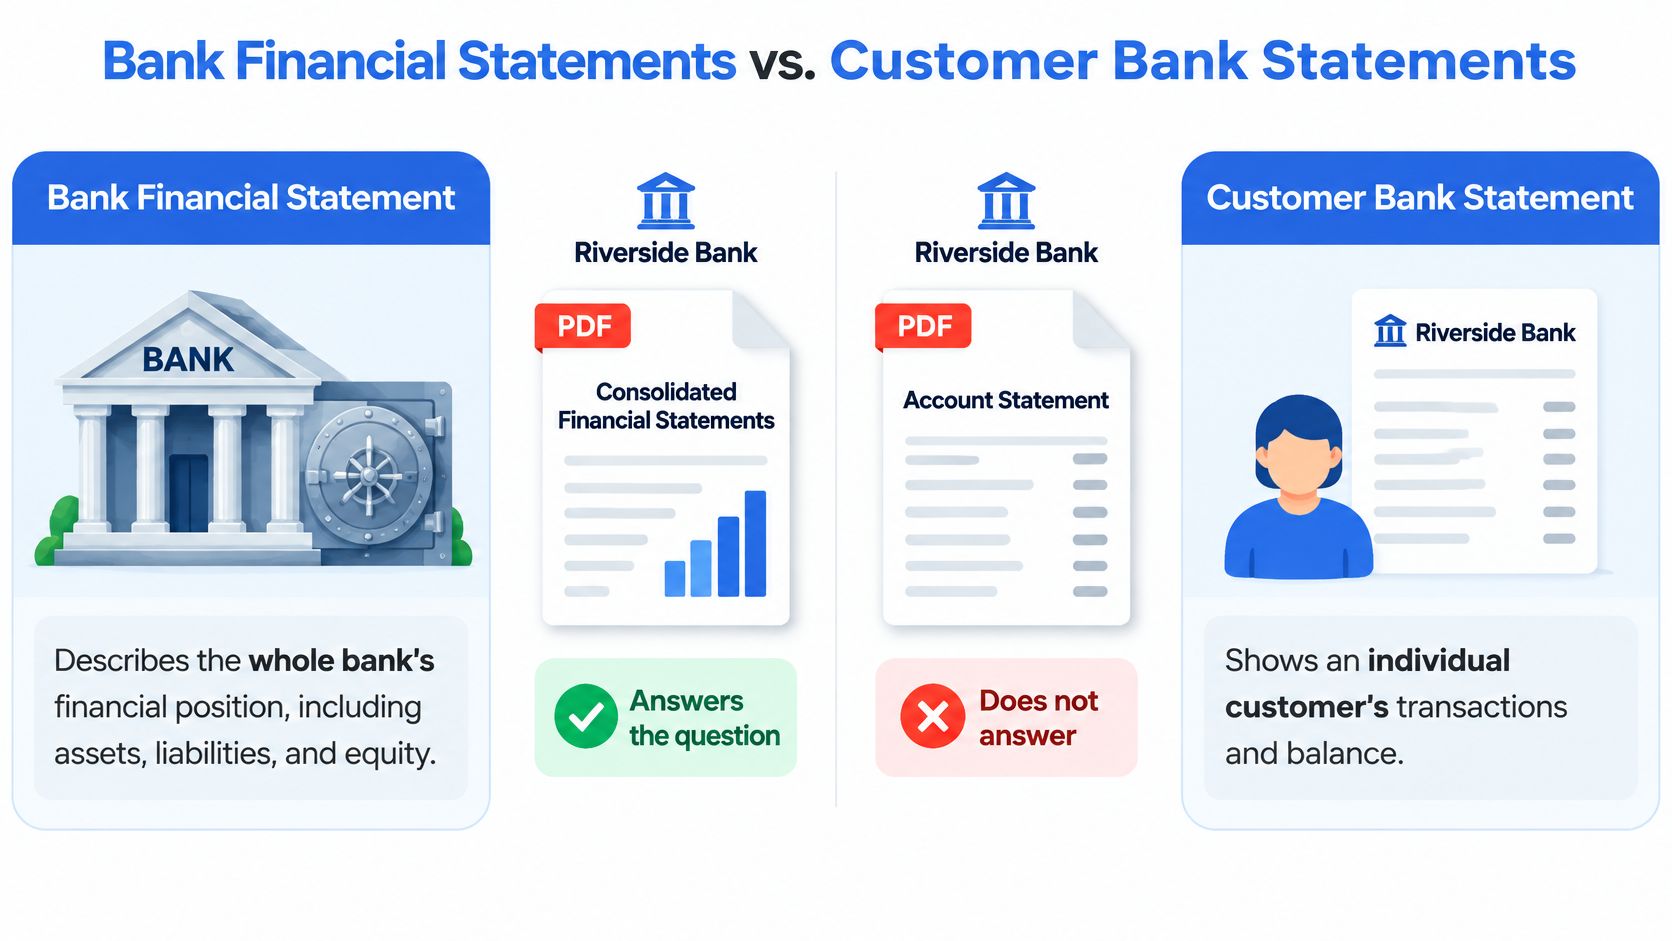
The rows below separate the two documents on the attributes that matter most when you're deciding which one to open.
| Feature | Bank financial statement | Customer bank statement |
|---|---|---|
| Issued by | The bank itself, for the whole institution | The bank, for one account holder |
| Scope | Entire bank group and all activities | One account over one statement period |
| Typical frequency | Annual, with interim reports for listed banks | Monthly or per statement cycle |
| Main contents | Balance sheet, income statement, cash flow statement, equity changes, notes | Transactions, running balances, fees and interest |
| Main purpose | Report financial position and performance to shareholders, regulators and markets | Show account activity and balances to the account holder |
| Level of detail | Aggregated line items explained in notes | Each transaction with date, description and amount |
| Where to find it | Annual report, investor relations page, regulatory filings | Online banking portal or mailed PDF |
The frequency row trips people up. A bank's annual report appears once a year, with interim updates if it's listed. Your statement arrives every month, which is why it feels like the more current document. It isn't more current about the bank. It's current about your balance.
Where the customer statement gets specific. The US Office of the Comptroller of the Currency guidance on checking accounts says a monthly statement must identify each electronic funds transfer transaction by its dollar amount, the date it cleared and the recipient's name. That's the minimum structure to look for. When we convert a statement into spreadsheet rows, each row has to keep the cleared amount and the payee, not just a free-text description that happens to mention them. The same guidance notes that a statement can serve as evidence of a payment by showing its date and amount, which is why those fields matter for bookkeeping, tax support and reconciliation.
If you want the customer-side basics in more depth, our guide on what a bank statement shows walks through the layout line by line.
Here's the rule that prevents the mix-up: before you read either document, write down the question you're trying to answer. Capital strength, lending growth and credit quality belong to the bank's financial statement. A missing deposit, an unexplained fee or a mismatch against your ledger belongs to the customer statement. Swap them and every conclusion after that is wrong.
The Four Statements a Bank Publishes and What Each Shows
A bank's annual report runs long because the primary statements sit on top of hundreds of pages of notes. Read them in a fixed order and the notes stop feeling like noise.
1. The balance sheet, or statement of financial position. One question: what does the bank own and owe on this date? The lines that matter are loans to customers, securities held, customer deposits, wholesale borrowings and total equity. For a lender, loans are both the inventory and the main source of risk, which is why this statement carries more weight than it would at a manufacturer.
2. The income statement. One question: what did the bank earn over the period, and what did it cost? Follow net interest income first, then fee and commission income, then the impairment or loan-loss charge, then operating expenses. Net profit is the last line, not the first thing to read.
3. The cash flow statement. One question: where did cash move? It splits into operating, investing and financing activities. Read it with a caveat. At a bank, lending and deposit flows often land inside operating activities, so a healthy operating cash figure doesn't tell you the bank is liquid. Liquidity lives in separate regulatory disclosures, not here.
4. The statement of changes in equity. One question: how did the owners' stake move? Retained earnings, dividends paid, shares issued and other listed gains and losses all reconcile the opening equity figure to the closing one. A bank can report a solid profit and still show flat equity if it paid most of that profit out.
5. The notes. One question per note. Accounting policies tell you how the numbers were built, credit-risk notes tell you what the loan book is made of, segment data tells you which business earned the profit, and regulatory capital notes connect the statements to the ratios we'll cover shortly.
First check before you analyse anything: every material figure in a primary statement should be traceable to a note that explains how it was built. If you can't find the note, you haven't finished reading the statement.
The ordering is deliberate. Reading profit first creates an anchor that's hard to shake, and a bank's profit is the figure most sensitive to estimates made inside the notes. Read the balance sheet, then the notes on the loan book, then come back to profit with context.
Reading the Balance Sheet and Income Statement Together
For a bank, the balance sheet and the income statement are two views of the same event. Credit losses are where they meet.
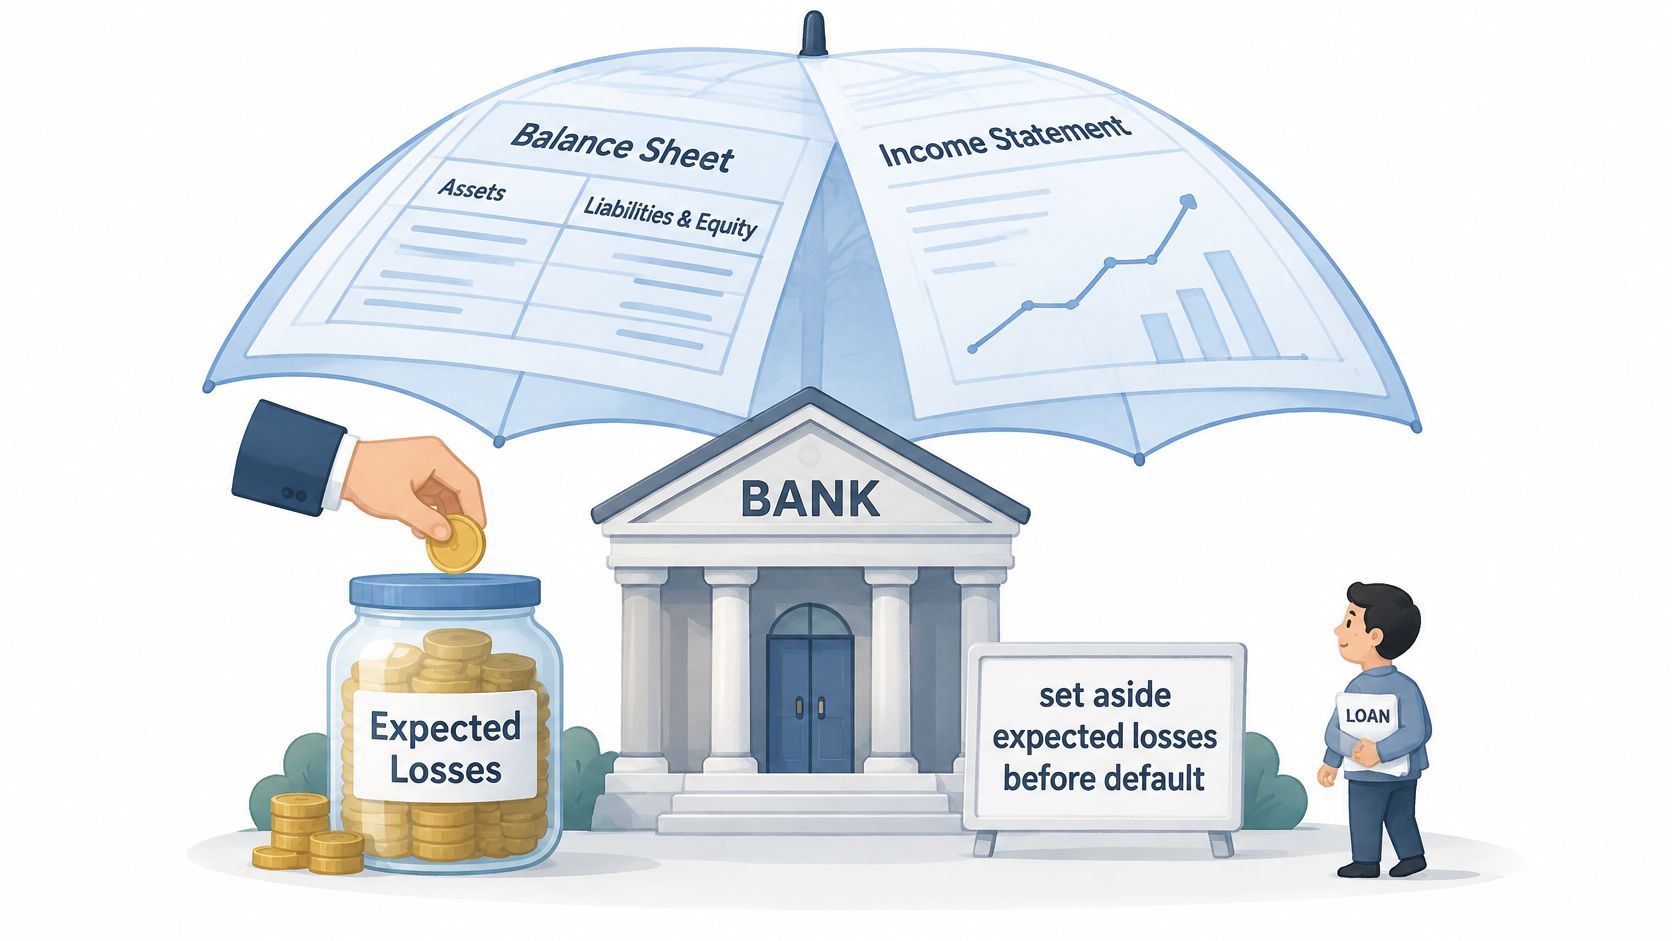
Under IFRS 9, the international accounting standard for financial instruments, a bank doesn't wait for a borrower to default before recognising a loss. It builds expected credit losses into the accounts using past events, current conditions and reasonable forecasts. The IFRS 9 illustrative examples published by the IFRS Foundation set out how this works in practice.
The household version: you keep an umbrella by the door before the rain arrives, not after you're soaked. A bank that expects tougher conditions provisions for them while the loans are still performing.
How the three measurement stages work
IFRS 9 splits the loan book into stages, and each stage uses a different loss measure.
| Stage | Loss measure applied | What puts a loan there |
|---|---|---|
| Performing, no significant increase in credit risk | 12-month expected credit losses | Origination or normal repayment behaviour |
| Significant increase in credit risk | Lifetime expected credit losses | Deteriorating borrower conditions or forecasts |
| Credit-impaired | Lifetime losses, with different interest-income treatment | Evidence of impairment |
The standard also requires expected credit losses to be discounted at the asset's effective interest rate, which ties the impairment calculation back to the interest economics the bank already recognises.
Trace one loan through all three statements
Take a single commercial loan and follow it.
- On the balance sheet, the loan sits inside loans to customers, net of its allowance. The gross balance and the allowance are usually shown separately in the notes.
- On the income statement, any increase in that allowance becomes an impairment charge, which reduces net profit.
- In equity, retained earnings fall by the same after-tax amount, so the statement of changes in equity carries the effect forward.
Nothing about the borrower's payment behaviour changed in that sequence. Only the forecast did.
A reading sequence a finance team can follow
- Loan book size first. Establish the gross balance before allowances, and note how it moved year on year.
- Allowance coverage next. Compare the allowance with the gross loan balance. A coverage ratio that falls while the loan book grows deserves a question.
- Impairment charge relative to loans. Put the period's charge against the average loan balance to see how much of the book is being provided for each year.
- Provisioning trend across periods. Three years of charges and allowances tells you more than one year ever will, especially when an economic forecast shifts.
Net profit at a bank is a measure of performance after a set of estimates, not an isolated scoreboard. Unemployment forecasts and interest-rate assumptions can move provisions, and therefore profit, long before any borrower misses a payment.
Keep that in mind when a quarter's profit jumps. Ask what happened to the impairment charge in the same period.
Capital and Liquidity Ratios Banks Report Beyond Profit
Profit tells you what a bank earned last period. Capital and liquidity ratios answer a different question: how much loss the balance sheet can absorb before depositors are exposed, and how long the funding lasts if depositors pull back. Basel III created the globally comparable framework for these measures, and the Basel Committee's original framework document scheduled its initial minimum requirements to be fully phased in by 1 January 2019.
| Measure | Basel III benchmark | What it tests |
|---|---|---|
| CET1 capital ratio | At least 4.5% of risk-weighted assets | Highest-quality capital against risk-weighted assets |
| Effective CET1 target | 7.0%, including the 2.5% conservation buffer | Buffer above the minimum before any systemic-bank surcharge |
| Tier 1 capital ratio | At least 6.0% of risk-weighted assets | Going-concern capital against risk-weighted assets |
| Total capital ratio | At least 8.0% of risk-weighted assets | Total regulatory capital against risk-weighted assets |
| Leverage ratio | At least 3.0% | Tier 1 capital against a broader exposure measure, not risk-weighted |
| Liquidity Coverage Ratio | 60% in 2015, rising in annual steps to 100% from 2019 | High-quality liquid assets against expected net cash outflows over 30 days |
Read every ratio by naming its two halves
A ratio means nothing until you can say what sits on top and what sits underneath.
CET1 puts common equity, mainly shares and retained earnings, over risk-weighted assets. The denominator is where judgment enters. Supervisory rules assign a risk weight to each asset class, so two banks holding similar loan books can still report different denominators. That mechanism also explains how the ratio moves: when retained earnings grow faster than risk-weighted assets, the ratio rises without a single new share being issued, and when the loan book grows faster than earnings, the ratio falls even in a profitable year.
Tier 1 adds other going-concern capital to common equity, and total capital adds tier 2 instruments on top of that. The spread between the three ratios shows how much of the capital base is made of instruments that absorb losses differently under stress.
The capital ratio is deliberately unweighted: tier 1 capital over a broad exposure measure. It acts as the backstop for a bank that looks well capitalised on risk-weighted numbers because its assets carry low weights.
Banks publish these figures in their Pillar 3 disclosures and in the regulatory capital note inside the annual report. A year-end Pillar 3 report shows the format those disclosures take. Read the ratio, then read the note that shows how each half was built.
Liquidity that profit cannot show
The Liquidity Coverage Ratio compares high-quality liquid assets with expected net cash outflows across a 30-day stress window. A profitable bank can still run short of cash inside that window, which is why the measure exists separately from the income statement.
Four checks round out the picture.
- The Net Stable Funding Ratio tests whether long-dated assets are funded with stable liabilities rather than short-term wholesale money.
- Deposit concentration shows whether funding depends on a handful of large depositors who could move in a week.
- Maturity gaps reveal how much of the balance sheet needs refinancing in the next twelve months.
- Encumbered assets and central-bank funding tell you how much of the asset base is already pledged, and therefore unavailable in a squeeze.
Reconcile each disclosure back to the published balance sheet. If a report says a large share of assets is encumbered, you should be able to locate the pledged assets in the balance sheet lines and supporting notes.
Compare against the requirement, not against another bank
The valid comparators are the regulatory minimum and the bank's own trend. Headline LCRs from different banks rarely line up cleanly, because published figures differ in methodology, reporting date, currency, and whether each number is a period-end reading or an average across several months. Two banks can both sit comfortably above the 100% requirement and still not be directly comparable on a single published figure.
A high LCR is not proof of safety. The metric covers a defined 30-day horizon and depends on assumptions about how quickly deposits run off and how liquid the qualifying assets really are on the day you need to sell them.
Read each ratio the same way the profit figure deserves to be read: find the numerator, find the denominator, and find the estimates sitting inside both.
How to Test Whether a Customer Statement Adds Up
Everything above concerns the bank. Now the document that concerns you, and the one control that catches more errors than any other.
- Note the opening balance from the first page, because it's the anchor every later figure depends on.
- Total all credits for the period, including interest received and any incoming transfers.
- Total all debits with signs kept consistent, so fees and payments never get added instead of subtracted.
- Calculate opening balance plus credits minus debits.
- Compare that result with the closing balance printed on the statement.
- Investigate any difference before the file is used for reporting.
Step six is where the work sits. A mismatch usually traces to missing rows, a duplicated transaction, an unrecorded bank fee, a pending item treated differently at each end, or an extraction error such as a misread digit or a flipped debit and credit sign.
Here's the arithmetic on hypothetical figures, so you can see what agreement looks like.
| Line | Amount |
|---|---|
| Opening balance | 2,000.00 |
| Total credits | 850.00 |
| Total debits | 1,240.50 |
| Expected closing balance (opening + credits − debits) | 1,609.50 |
If the statement prints 1,609.50 as its closing balance, the arithmetic agrees and the rows are complete. If it prints something else, stop. Don't average, don't plug the difference into a suspense line, and don't post.
The OCC Comptroller's Handbook on regulatory reporting describes this discipline as a reconciliation process with two requirements that scale down neatly to a single bank account. Segregation of duties should apply when reconciling general-ledger accounts to reported figures, and work papers plus supporting documentation should permit a proper audit trail.
For a converted statement, that means keeping the original PDF alongside the spreadsheet, logging every correction you make, and recording who reviewed the result. OCR misreads and unusual layouts are exactly the cases where dates, descriptions and signs drift, and where a reviewer needs to see what changed.
A full walkthrough of the checks sits in our guide to checking bank statements if you want the review sequence in more detail.
Choose the Right Statement Before You Analyze or Reconcile
Two paths, decided by one question: whose money are you examining?
If you're assessing a bank as a counterparty, lender or investor, start with its annual report and interim filings, then its Pillar 3 disclosures. Read the balance sheet and the credit-risk notes first, because the loan book and the loss allowances shape everything else on the page. Come back to the income statement with the impairment charge in view, and finish by checking each capital and liquidity ratio against its requirement and against the bank's own prior periods. One quarter's profit, on its own, tells you very little: a bank can post a strong result while credit losses build inside the loan book.
If you're reconciling your own account, pull the customer statement for the full period and confirm it runs from first page to last. Run the opening-plus-credits-minus-debits check before a single row reaches your ledger. When the source is a PDF that needs to become a working file, convert it first, then run the same test on the converted rows and spot-check them against the source pages. If the layout itself is unfamiliar, our overview of the bank account statement explains what each section shows.
autobankstatement handles the conversion step directly. It turns bank statement PDFs into CSV or Excel files, works with digital, scanned and password-protected statements, accepts files up to 25 MB, and offers a free guest preview before payment. The uploaded statement is used only to complete the conversion and is deleted within 10 seconds after processing finishes. What you download is a clean spreadsheet ready for bookkeeping, taxes, reconciliation or reporting.
Treat that spreadsheet as a working copy. The original PDF stays the document of record, so keep it beside the export and keep the check.
Confirm the totals first. Then analyse, or post.
When the document in front of you is a customer statement rather than a published annual report, conversion is the step that turns it into something you can test line by line. Visit autobankstatement to convert your first statement, then run the arithmetic on the exported rows before anything reaches your books.
Convert your next statement in minutes
Upload a bank statement PDF — digital, scanned, or password-protected — preview the extracted table, and download clean CSV or Excel.